Display real-time tweets on a map with Basemap and Tweepy
MatPlotlib basemap is a library for plotting 2D data on a map using Python. In this post I will show you how to get tweets from Twitter with Tweepy and how to display them on a map with Basemap.
Updated 15.01.2019 : Code updated
Updated 26.04.2018 : Installation with Anaconda instead of pip. Because basemap is not available on pip anymore.
1. Installation with Anaconda
I recommand you to use Anaconda to create a new environment. Install the following dependencies with conda.
Since Python 3.4 you can't install Basemap from pip. The easy way to install it is with anaconda.
conda install -c conda-forge tweepy
conda install matplotlib numpy pandas shapely scipy pysal Fiona descartes basemap pillow
2. Basemap
Here's a simple example of how to draw a map!
I am using the "Mercator Projection" because it's a common projection and I like it ;) But you can find other pretty projections on MatPlotlib website :
Create a file named : myMap.py with this code :
# Map size
fig = plt.figure(figsize=(18,4), dpi=200)
# Set a title
plt.title("Tweet's around the world")
# Declare map projection, size and resolution
map = Basemap(projection='merc',
llcrnrlat=-80,
urcrnrlat=80,
llcrnrlon=-180,
urcrnrlon=180,
lat_ts=20,
resolution='l')
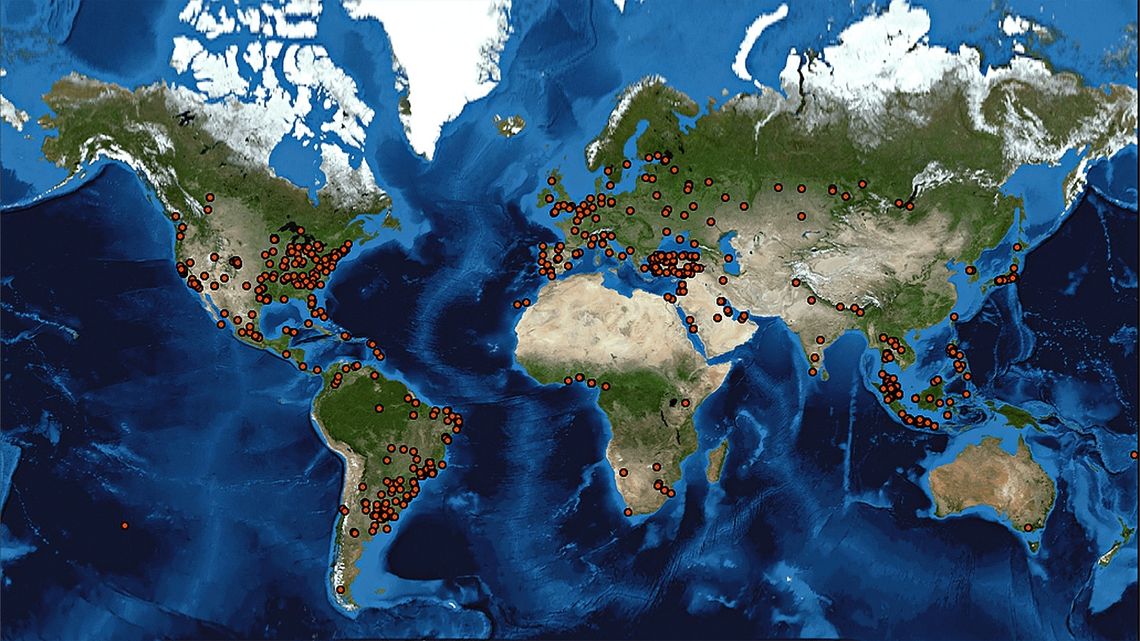
# I love bluemarble image
map.bluemarble(scale=0.3)
# Display map
plt.show()
Notes :
- resolution parameter : Can be c (crude), l (low), i (intermediate), h (high), f (full) or None. If None, no boundary data will be read in (and class methods such as drawcoastlines will raise an if invoked)
2.1 Basemap
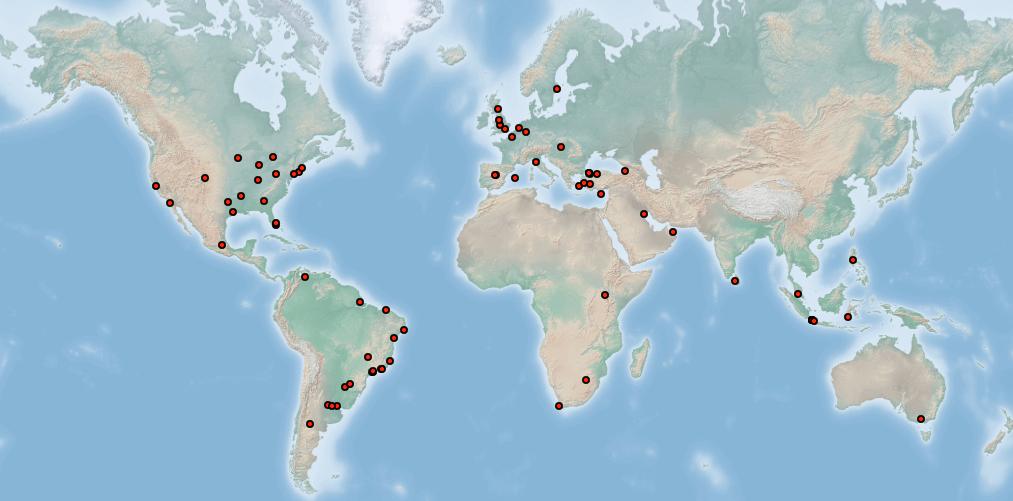
In the previous post, map was using "NASA Blue Marble" image. But you can set it to :
Scale is set to 0.5 to reduce image size to downsamples to 2700x1350
# Draw a shaded relief image
map.shadedrelief(scale=0.5)
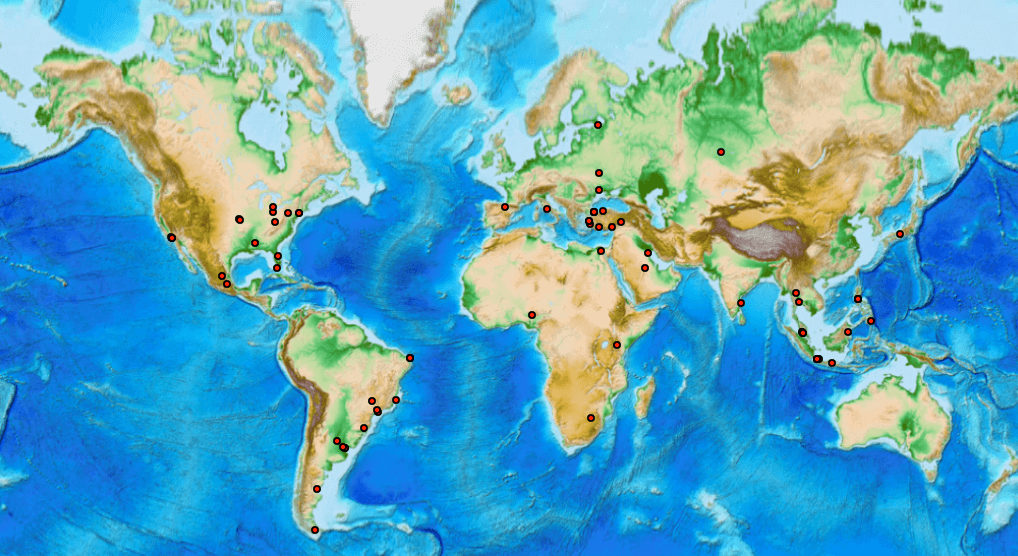
# Draw a etopo relief image
map.etopo(scale=0.5)
3. Tweepy
Let's use Streaming API! If you need more information about Tweepy, please read my previous post : Twitter Streaming API with Tweepy
3.1 Authentication
Create a file named authenticate.py and paste the following code:
class authentication:

def __init__(self):
# Go to http://apps.twitter.com and create an app
# The consumer key and secret will be generated for you after
self.consumer_key ="xxx"
self.consumer_secret="xx"

# Create an access token under the "Your access token" section
self.access_token="xxx"
self.access_token_secret="xxx"

def getconsumer_key(self):
	return self.consumer_key

def getconsumer_secret(self):
	return self.consumer_secret
def getaccess_token(self):
	return self.access_token
def getaccess_token_secret(self):
	return self.access_token_secret
Do not forget to change xxx with your own access key and token.
3.2 Read the stream
Go back to your myMap.py file and add this in the main:
from authentication import authentication  # Consumer and access token/key

# Get access and key from another class
auth = authentication()

consumer_key = auth.getconsumer_key()
consumer_secret = auth.getconsumer_secret()

access_token = auth.getaccess_token()
access_token_secret = auth.getaccess_token_secret()

# Authentication
auth = tweepy.OAuthHandler(consumer_key, consumer_secret)
auth.secure = True
auth.set_access_token(access_token, access_token_secret)

api = tweepy.API(auth, wait_on_rate_limit=True, wait_on_rate_limit_notify=True, retry_count=10, retry_delay=5, retry_errors=5)

streamListener = TwitterStreamListener()
myStream = tweepy.Stream(auth=api.auth, listener=streamListener)

# Read all the stream around the world
myStream.filter(locations=[-180,-90,180,90])
Note:
- filter(locations=[-180,-90,180,90] : is a little trick to get rid of the require filter word. Instead you write a location filter which is the whole world.
Now you have to implement StreamListener to get the stream :
class TwitterStreamListener(tweepy.StreamListener):
    """ A listener handles tweets are the received from the stream.
    This is a basic listener that just prints received tweets to stdout.
    """

	def on_status(self, status):
		self.get_tweet(status)

	# Twitter error list : https://dev.twitter.com/overview/api/response-codes
	def on_error(self, status_code):
		if status_code == 403:
			print("The request is understood, but it has been refused or access is not allowed. Limit is maybe reached")
			return False
As you can see, on_status method call get_tweet method. This method will get tweet's location and display it on the map we created previously :
@staticmethod
	def get_tweet(tweet):
		if tweet.coordinates is not None:
			x,y = map(tweet.coordinates['coordinates'][0], tweet.coordinates['coordinates'][1])
			map.plot(x, y, 'ro', markersize=2)
  			plt.pause(0.01) # little trick to update the map
- Line 3 : We check if coordinates are set. Many tweets did not provide any coordinates. We get the Longitude and Latitude position and we set it to map object, which return a x and y position. Map will transform coordinates to x,y position.
- Line 5 : We plot a point in the map.
- 'bo' and 'ro' are two concatenated strings: a one-character string representing the color plus a one-character string representing the line style, in this case, a dot.
More information here and the color API
If you need another color than red of blue, you can set a color name, hex codes or RGB tuples in the following color field :
map.plot(x, y, color='green', linestyle='dashed', marker='o')
4. Complete code
__author__ = 'michaelcaraccio'

from mpl_toolkits.basemap import Basemap
import matplotlib.pyplot as plt
import tweepy

from authentication import authentication  # Consumer and access token/key


class TwitterStreamListener(tweepy.StreamListener):
    """ A listener handles tweets are the received from the stream.
    This is a basic listener that just prints received tweets to stdout.
    """

    def on_status(self, status):
        self.get_tweet(status)

    def on_error(self, status_code):
        if status_code == 403:
            print("The request is understood, but it has been refused or access is not allowed. Limit is maybe reached")
            return False

    @staticmethod
    def get_tweet(tweet):

        if tweet.coordinates is not None:
            print(tweet)
            x, y = map(tweet.coordinates['coordinates'][0], tweet.coordinates['coordinates'][1])
            map.plot(x, y, 'ro', markersize=2)
            plt.pause(0.01) # little trick to update the map


if __name__ == '__main__':

    # Size of the map
    fig = plt.figure(figsize=(18, 4), dpi=200)

    # Set a title
    plt.title("Tweet's around the world")

    # Declare map projection, size and resolution
    map = Basemap(projection='merc',
                  llcrnrlat=-80,
                  urcrnrlat=80,
                  llcrnrlon=-180,
                  urcrnrlon=180,
                  lat_ts=20,
                  resolution='l')

    map.bluemarble(scale=0.3)

    # Get access and key from another class
    auth = authentication()

    consumer_key = auth.getconsumer_key()
    consumer_secret = auth.getconsumer_secret()

    access_token = auth.getaccess_token()
    access_token_secret = auth.getaccess_token_secret()

    # Authentication
    auth = tweepy.OAuthHandler(consumer_key, consumer_secret)
    auth.secure = True
    auth.set_access_token(access_token, access_token_secret)

    api = tweepy.API(auth, wait_on_rate_limit=True, wait_on_rate_limit_notify=True, retry_count=10, retry_delay=5,
                     retry_errors=5)

    streamListener = TwitterStreamListener()
    myStream = tweepy.Stream(auth=api.auth, listener=streamListener)

    myStream.filter(locations=[-180, -90, 180, 90])
Sources :
Geography with Basemap
Setting up the map
Basemap constructor parameters
Member discussion